
 

Introducing VMware Identity Manager Cluster Auto-Recovery in VMware Aria Suite Lifecycle 8.14

We are excited to announce VMware Aria Suite Lifecycle 8.14 introduces an innovative capability known as “VMware Identity Manager Cluster Auto-Recovery”.

The new ‘autorecovery’ service minimizes the use of the time-consuming ‘Remediate’ process from the Suite Lifecycle UI.

New deployments of VMware Aria Suite Lifecycle 8.14 ship with the VMware Identity Manager Cluster Auto-Recovery enabled. You may enable the VMware Identity Manager Cluster Auto-Recovery feature for upgraded deployments on the ‘globalenvironment’ environment tile.

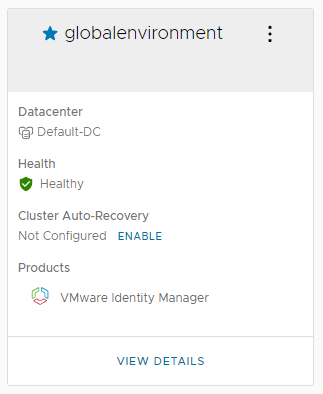
VMware Identity Manager Cluster Auto-Recovery not configured.


About the ‘autorecovery’ service

The ‘autorecovery’ service is a Linux service, running on all three nodes within the vIDM cluster.

With the new ‘autorecovery’ service:

  • pgPool service starts and restarts are controlled programmatically.
  • Only the primary role node will have the cluster VIP or delegateIP applied.
  • Detachment of VIO is performed only on standby nodes with the standby role.
  • Recovery is synchronized based on the node’s status as database primary and cluster leader is applied if all nodes are noting standby.

These significant improvements ensure duplicate operations are no longer executed on the cluster nodes.


Features of the ‘autorecovery’ service

  • Remediates cluster VIP loss on primary role node.
  • Resolves cluster issues due to network outages.
  • Recovery of “down” cluster node/s.
  • Avoids the necessity to initiate “Remediate” from UI in most cases, which involves node(s) restarts contributing to downtime.
  • Eliminates the necessity of rebooting vIDM nodes because of PostgreSQL cluster problems.
  • Recovery in cases with significant replication delay (‘significant’ configurable in bytes, more than 1000 bytes of lag between primary and secondary nodes)
  • Recovery in rare cases of all nodes are in a ‘standby’ state
  • Prevent discrepancies in the /etc/hosts

Downtime

No, there is no downtime when the auto-recovery script runs.


Toggle the VMware Identity Manager Cluster Auto-Recovery feature

Once enabled, users can come to the day-2 operations pane of ‘globalenvironment’ or vIDM and then choose to disable and vice-versa.

Comments

Popular posts from this blog

Step-by-Step Explanation of Ballooning, Compression & Swapping in VMware

 🔹 Step-by-Step Explanation of Ballooning, Compression & Swapping in VMware ⸻ 1️⃣ Memory Ballooning (vmmemctl) Ballooning is the first memory reclamation technique used when ESXi detects memory pressure. ➤ Step-by-Step: How Ballooning Works  1. VMware Tools installs the balloon driver (vmmemctl) inside the guest OS.  2. ESXi detects low free memory on the host.  3. ESXi inflates the balloon in selected VMs.  4. Balloon driver occupies guest memory, making the OS think RAM is full.  5. Guest OS frees idle / unused pages (because it believes memory is needed).  6. ESXi reclaims those freed pages and makes them available to other VMs. Why Ballooning Happens?  • Host free memory is very low.  • ESXi wants the VM to release unused pages before resorting to swapping. Example  • Host memory: 64 GB  • VMs used: 62 GB  • Free: 2 GB → ESXi triggers ballooning  • VM1 (8 GB RAM): Balloon inflates to 2 GB → OS frees 2 GB → ESXi re...

ESXi Host Troubleshooting Checklist

  🛠️ ESXi Host Troubleshooting Checklist (With Complete Log Locations) ✅ 1. Host Status & Connectivity Check host state in vCenter (Connected / Not Responding / Disconnected) Review CPU, RAM, and datastore usage Validate HA/DRS recommendations ✅ 2. Hardware Health Monitor hardware sensors (CPU, DIMMs, fans, PSU, RAID) Check RAID controller logs via vendor tools View hardware status in: vCenter → Monitor → Hardware Health DCUI → Hardware Status ✅ 3. Network Validation Verify vSwitches, Port Groups, NIC teaming, VLAN tagging Check vmkernel ports (mgmt, vMotion, iSCSI, vSAN) Test reachability using: Shell vmkping < IP > Show more lines Validate physical NIC status and link speed ✅ 4. Storage & Datastore Checks Confirm datastore accessibility Rescan storage adapters (iSCSI/FC/NFS) Validate multipathing (Round Robin / Fixed / MRU) Check datastore latency with esxtop ✅ **5. Critical Logs & Their Locations (Full List) Here are key ESXi log files that every VMware adm...
  vCenter Troubleshooting Tips, Common Issues & Log Locations 🚀 1. General Troubleshooting Approach A. Check service health first For vCenter Server Appliance (VCSA): Shell https : / / < vcenter - FQDN > : 5480 Show more lines Go to Services → Health to verify: vCenter Server ESXi hosts vSphere Client DNS, NTP, DB connections vpxd, vpxd-svcs, vsphere-ui B. DNS & NTP checks vCenter is highly dependent on correct DNS & time sync. Check: Shell nslookup < vcenter - fqdn > nslookup < esxi - host - fqdn > Show more lines Time drift > 5 minutes causes: Login failures vpxd crashes PSC authentication issues C. Check storage/database health Slow DB/storage = UI slow, tasks hung. For VCSA: Shell df - h du - sh / storage / log / * / var / log Show more lines Free up space if partitions hit >80%. D. Restart critical services safely On VCSA: Shell service - control - - status service - control - - stop - - all service - control - - start - - all ...