Server Hung or unresponsive become common issues in system
administration. Advanced Hardware and hardware monitoring tools have
the capability to send alerts in-case server become unresponsive due to
hardware faults or parts failure. with the latest technology, lots of
organization moved entirely into virtualization and highly critical
workloads are running in Virtual machines. It is real important to
identify and provide the justification and Route Cause analysis for the
downtime of critical applications is one of the important tasks of
systems administrators. It’s been a real tough to identify the route
cause of virtual machine become unresponsive or hung issues. We will be
just left with reboot option when we come across this type of issues in
virtual machine. To better identify the route of this issue, We can
generate the Crash dump using free tool from VMware Fling
called Vmss2core.
Vmss2core is a tool to convert VMware checkpoint state files into formats that third party debugger tools understand. It can handle both suspend (.vmss) and snapshot (.vmsn) checkpoint state files .The vmss2core tool can produce core dump files for the Windows debugger (WinDbg), Red Hat crash compatible core files, a physical memory view suitable for the Gnu debugger gdb, Solaris MDB (XXX), and Mac OS X formats.
Below is the procedure to generate the crash dump or core dump of VMware Guests
1. When the Guest OS is Hung or unresponsive, Login to the vCenter Server or ESXi host using vSphere Client or vSphere Web Client
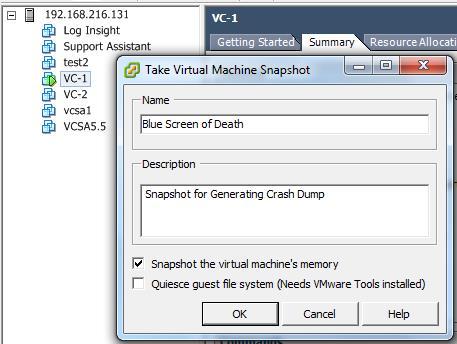
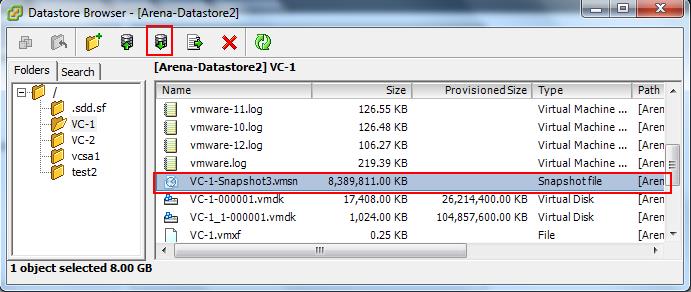
2. Take the Snapshot of the Virtual Machine which is hung or unresponsive state. Which will create .vmsn file in the virtual machine directory


Alternative to the snapshot, You can place the virtual Machine in Suspend State by Right-Click the hung Virtual Machine -> Power -> Suspend. Which will create .vmss file in the virtual machine directory.

3. Select the .vmsn or .vmss file and download to your local machine where you are going to save the Vmss2core utility.
4. Download the Vmss2core from VMware Fling Site and place the downloaded file (vmss2core_win.exe) in your local drive (C:\ or D:\). Ensure your Windows machine is installed with Visual Studio 2008 Service Pack 1 runtime. Place both the Vmss2core file and downloaded .vmsn or .vmss file in same location
5. Execute the below commands to generate core dump. The vmss2core tool can produce core dump files for the Windows debugger (WinDbg), Red Hat crash compatible core files, a physical memory view suitable for the Gnu debugger gdb, Solaris MDB (XXX), and Mac OS X formats.
c:\>vmss2core_win.exe -M VC-1-Snapshot3.vmsn

The above command generate the output file called “vmss.core” for Linux and Solaris. For Windows, It generates a file called *.dmp extension. You can share the crash dump files to your operating system vendor to identify the route cause of Hung or Crash.
Below are the list of command line switches available for vmsscore utility.
I hope this is informative for you. Thanks for Reading !!!. Be Social
and Share it in social media, If you feel worth sharing it.
Vmss2core is a tool to convert VMware checkpoint state files into formats that third party debugger tools understand. It can handle both suspend (.vmss) and snapshot (.vmsn) checkpoint state files .The vmss2core tool can produce core dump files for the Windows debugger (WinDbg), Red Hat crash compatible core files, a physical memory view suitable for the Gnu debugger gdb, Solaris MDB (XXX), and Mac OS X formats.
Below is the procedure to generate the crash dump or core dump of VMware Guests
1. When the Guest OS is Hung or unresponsive, Login to the vCenter Server or ESXi host using vSphere Client or vSphere Web Client
2. Take the Snapshot of the Virtual Machine which is hung or unresponsive state. Which will create .vmsn file in the virtual machine directory
Alternative to the snapshot, You can place the virtual Machine in Suspend State by Right-Click the hung Virtual Machine -> Power -> Suspend. Which will create .vmss file in the virtual machine directory.
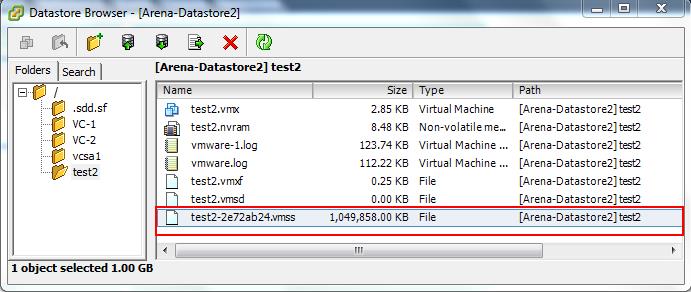
3. Select the .vmsn or .vmss file and download to your local machine where you are going to save the Vmss2core utility.
4. Download the Vmss2core from VMware Fling Site and place the downloaded file (vmss2core_win.exe) in your local drive (C:\ or D:\). Ensure your Windows machine is installed with Visual Studio 2008 Service Pack 1 runtime. Place both the Vmss2core file and downloaded .vmsn or .vmss file in same location
5. Execute the below commands to generate core dump. The vmss2core tool can produce core dump files for the Windows debugger (WinDbg), Red Hat crash compatible core files, a physical memory view suitable for the Gnu debugger gdb, Solaris MDB (XXX), and Mac OS X formats.
c:\>vmss2core_win.exe -M VC-1-Snapshot3.vmsn
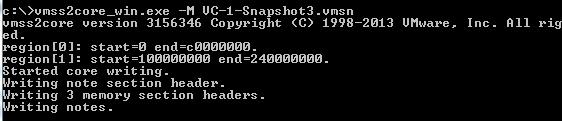
The above command generate the output file called “vmss.core” for Linux and Solaris. For Windows, It generates a file called *.dmp extension. You can share the crash dump files to your operating system vendor to identify the route cause of Hung or Crash.
Below are the list of command line switches available for vmsscore utility.
| Options | Explanation |
| (none) | Without any options, produces linear views of memory (vmss.core<n>) one per virtual CPU. |
| -W | Creates aWinDbgfile (memory.dmp)of aWindowsvirtualmachinewithcommonlyusedbuildnumbers, 2195 for Win32 and 6000 for Win64. |
| -W<num> | Creates a WinDbg file (memory.dmp) with <num> as the build number,for example: -W2600 |
| -WDDB<num> | Creates aWinDbg file (memory.dmp) with <num> as thedebugger data block address in hexadecimal,for example: -W12ac34de |
| -WSCAN | Creates aWinDbg file (memory.dmp) and scan all of memory forthe debugger data block, instead ofjust the lower 256 MB |
| -M | Creates a core file (vmss.core) with a physical memory view suitable forthe Gnu debugger gdb |
| -l <str> | Specifies the starting andending offsets ofLinux kerneldata structures for use by the -N and-P options, with <str> expressed as 0xHEXNUM,0xHEXNUM. Ignored when used with other options. |
| -N | Red Hat crash core file (vmss.core) for an arbitrary Linux version as defined by the -l option. |
| -N4 | Red Hat crash core file (vmss.core) for Linux kernel version 2.4. |
| -N6 | Red Hat crash core file (vmss.core) for Linux kernel version 2.6. |
| -P | Prints a list of processes running in the Linux virtual machine at checkpoint time |
| -P<pid> | Creates a core file (core.<pid>) forthe Linux process number <pid>. Itis likely thatprograms compiledwithsymboltables (notremoved)willyieldbetterdebug information |
| -X<nn-v> | Mac OS core dump with <nn-v> representing architecture and Darwin kernel version |
| -q | Quiet operation. |
Comments
Post a Comment